Measuring trade show success: The KPIs that really count.
A trade show takes time, staff, and budget. But neither a busy booth nor the sheer number of conversations tells you whether it was worth it. The real question is which contacts are relevant and which sales opportunities come out of them.
Trade show performance tracking helps exhibitors assess their participation against specific metrics, from the first conversation to the business that eventually comes out of it.
So if you want to measure success, don't wait until after the event to start your analysis. The key is to set the right goals and KPIs up front.
In short: The most important trade show KPIs are qualified leads, qualification rate, follow-up rate, conversion rate, and cost per qualified lead. During the show, operational metrics help you stay on course. Whether the investment paid off only becomes clear after the show, as you review results and track how your contacts develop.
What is trade show performance tracking?
Trade show performance tracking is the systematic planning and evaluation of what your trade show participation achieves. The aim is to compare actual results with the goals you set in advance and use the findings to improve future events.
The process has three phases:
- Before the show: Set goals and KPIs.
- During the show: Monitor how lead capture is progressing.
- After the show: Analyze contact quality, sales opportunities, and costs.
Which KPIs are relevant depends on your goal for the show. A company that wants to win new customers needs different KPIs than one that is nurturing existing customers or gathering market intelligence.
When does trade show performance tracking begin?
Trade show performance tracking begins before the first day of the show. Without clearly defined goals, you can't judge afterward whether the show was a success.
So answer these questions in advance:
- What goals are we pursuing?
- Which target audiences do we want to reach?
- When does a contact count as a qualified lead?
- What information do we need to capture?
- Which KPIs will we use to measure success?
Here's an example: Instead of simply collecting as many contacts as possible, a company sets specific targets for qualified leads and agreed follow-up meetings. This makes data capture at the booth more focused and the post-show analysis more meaningful.
Which trade show KPIs really matter?
The most important trade show KPIs build on each other in a simple sequence:
Contact → quality → next step → conversion → cost
The five most important trade show KPIs at a glance
| KPI | Calculation | What it tells you |
|---|---|---|
| Qualified leads | Number of contacts that meet your criteria | How many relevant contacts did you gain? |
| Qualification rate | Qualified leads ÷ all contacts × 100 | What share of your contacts is relevant? |
| Follow-up rate | Qualified leads with an agreed next step ÷ qualified leads × 100 | How many leads move on to a next step? |
| Conversion rate | Contacts that reach the next stage ÷ contacts at the starting stage × 100 | How are your leads developing? |
| Cost per qualified lead | Total trade show costs ÷ qualified leads | How efficiently did you gain relevant contacts? |
These calculations are examples. Be sure to clearly define which contacts and which time period each KPI refers to.
1. Qualified leads: How many relevant contacts did you gain?
The number of booth contacts shows how many interactions were documented. On its own, it says little about the show's success.
The key is how many contacts actually belong to your target audience and meet your qualification criteria. These can include industry, company size, specific needs, and business potential.
Example: Of 500 captured contacts, 180 meet the criteria and count as qualified leads.
2. Qualification rate: How well do the contacts fit?
The qualification rate shows what share of your contacts meets your criteria. In the example above, that's 180 out of 500, or 36 percent.
Not every contact has the same potential, though. Besides target audience fit, factors such as specific needs, the contact's role, and potential business opportunities also play a part.
A lead scoring model can combine these criteria into a single, consistent rating and help you prioritize leads for follow-up.
With snapAddy VisitReport, you can create custom questionnaires for your trade show conversations and structure the information you capture around your company's qualification criteria.
Keep in mind that a lead score is not an objective measure of future business success. It is a rating based on the criteria you set in advance.
3. Follow-up rate: What happens after the conversation?
A qualified lead isn't a sale yet. The key is whether you agreed on a specific next step, such as a callback, a consultation, or a product demo.
Example: You agree on follow-up activities with 72 of 180 qualified leads. The follow-up rate is 40 percent.
This KPI shows how many qualified leads move into your sales process.
4. Conversion rate: What becomes of your trade show contacts?
Many trade show contacts only turn into customers weeks or months later. That's why you should systematically track how they develop.
A typical sales process might look like this:
Contact → qualified lead → meeting → opportunity → proposal → customer
The conversion rate shows what share of a starting group reaches the next defined stage.
Example: Of 72 agreed follow-up activities, 36 lead to a meeting that actually takes place. The conversion rate is 50 percent.
Decide which stages you want to measure, and only compare KPIs that use the same definition. Don't judge the show solely by the deals closed right after the last day.
5. Cost per qualified lead: What did the show cost?
When calculating total costs, include items such as booth space, booth construction, staff, travel, preparation, and follow-up.
From this, you can derive several KPIs:
- Cost per contact
- Cost per qualified lead
- Cost per customer won
When you compare them with previous shows or other sales activities, these figures show how much it cost to achieve your results. For a full picture, also consider how your pipeline and opportunities develop over time.
Which other KPIs are useful?
Depending on your goal for the show, additional KPIs can be helpful:
- Existing customer contacts: How actively did you nurture existing customer relationships?
- Target audience distribution: Did you reach the industries and company sizes you wanted?
- Visitor surveys: Which needs, interests, or opinions did you capture?
- Time spent at the booth: How in-depth were the conversations? Duration alone says nothing about their quality, though.
Focus on KPIs that actually support your goals and decisions.
During the show: Making the most of live metrics
At a multi-day trade show, up-to-date metrics help you keep track of booth activity and lead capture. At this stage, the focus is on managing the event, not on the final business outcome.
Relevant metrics include:
- visit reports created and completed
- reports still open
- report activity over time
- the capture methods used
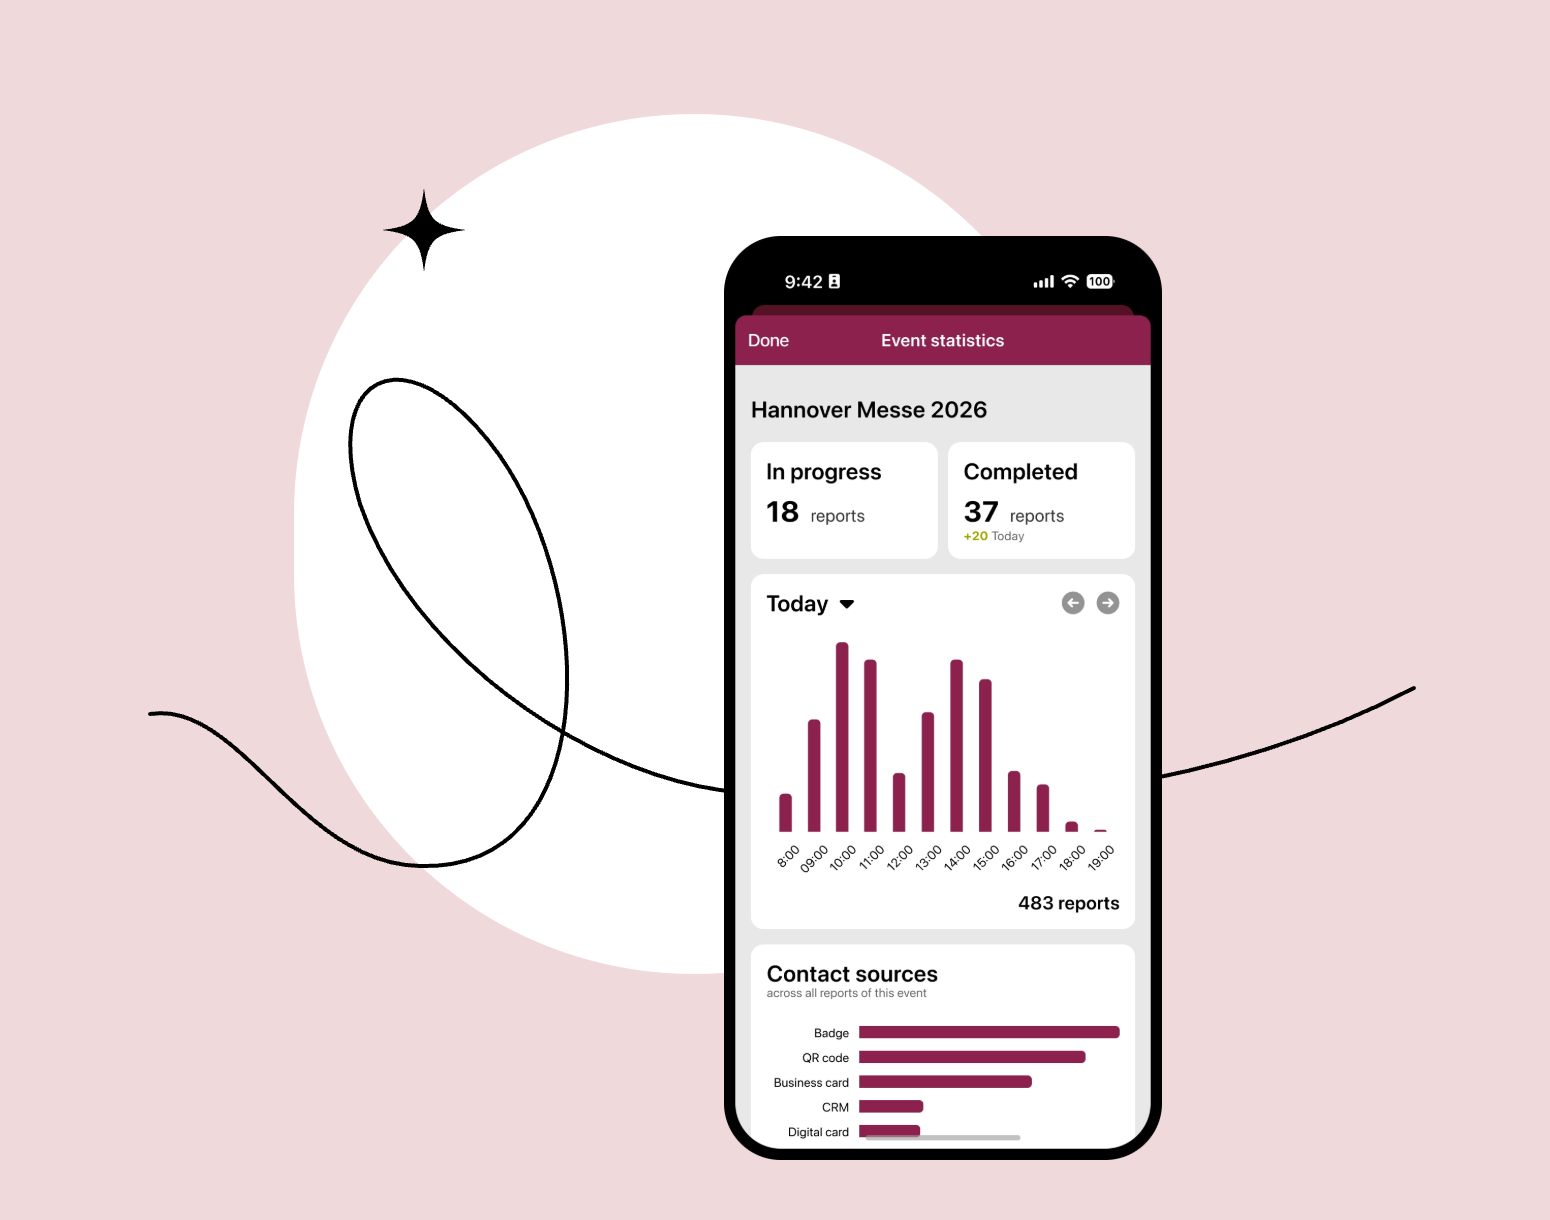
Event analytics in snapAddy VisitReport
With the mobile event analytics in snapAddy VisitReport, admins and event managers can view key metrics for the ongoing event right on their smartphones.
The overview shows how many visit reports have been created and completed, how report activity is distributed throughout the day, and which capture methods are being used.
This lets you see where visit reports are still incomplete and how lead capture is going on the show floor.
After the show: Analyzing and comparing results
After the event, compare the data you captured with the goals you set in advance. The key factors are the number of qualified leads, agreed follow-up activities, how those leads convert, and the costs incurred.
Goal attainment and benchmarks
A single KPI is rarely meaningful on its own. So compare your results with your target values and with comparable events.
This is how you calculate goal attainment:
Goal attainment in percent = actual result ÷ target value × 100
If you planned for 150 qualified leads and reached 172, your goal attainment is 114.7 percent.
That doesn't automatically mean the show was a financial success. For that, you also need to factor in contact quality, later sales results, and costs.
Comparisons with previous events are especially helpful when the target audiences, show format, and other circumstances are similar.
How can you track trade show KPIs digitally?
If you enter business card details by hand, type up notes, and merge spreadsheets after the show, you lose time and risk transcription errors. That's why it makes sense to capture leads digitally right at the booth.
Documenting trade show conversations with snapAddy VisitReport
With snapAddy VisitReport, you can combine different question types in your questionnaires and add dependent questions as needed. The integrated business card scanner adds contact details to the visit report, which you can then transfer to your CRM system.
Evaluating trade show KPIs in the dashboard
For a detailed analysis after the show, the VisitReport dashboard offers several ways to evaluate your data. You can analyze answers to individual questions, review visit reports by user, and track how the number of reports changes over time.
Results can be displayed as pie, column, or bar charts, in absolute numbers or percentages.
This way, the information you captured is structured and ready to analyze. How meaningful the results are, however, depends on the quality of the data and the goals you set in advance.
Conclusion: Making trade show success measurable
Trade show performance tracking starts well before the show opens. Define your goals, set suitable KPIs, and capture the information you need for your post-show analysis.
During the show, operational metrics help you monitor lead capture. After the event, what counts most are qualified leads, qualification rate, follow-up rate, conversion rate, and cost per qualified lead.
With snapAddy VisitReport, you can document trade show conversations in a structured way and analyze the captured data during follow-up.
This replaces the question "How many contacts did we have?" with more useful ones: Which contacts were relevant, what came of them, and what can we improve at our next trade show?
Want to see which metrics snapAddy VisitReport provides during and after the show? Learn more about digital visit reports and trade show analytics.
FAQ.
The most important trade show KPIs include qualified leads, qualification rate, follow-up rate, conversion rate, and cost per qualified lead. Which KPIs take center stage depends on your goal for the show.
Compare your actual results with the goals you set in advance. In addition to the number and quality of contacts, take follow-up activities, later sales results, and costs into account.
Planning starts before the show. During the event, operational metrics help you manage it. After the show, you analyze contact quality and sales results. Because leads often turn into customers only later, keep tracking results over a longer period.
Operational metrics such as created and completed visit reports, open reports, and report activity over time give you an overview of ongoing lead capture.
Mobile event analytics are intended for admins and event managers. The data available depends on the feature set and each user's permissions.
Event analytics give you an operational overview during the show. The dashboard lets you analyze the captured information in detail, for example by question or over time.